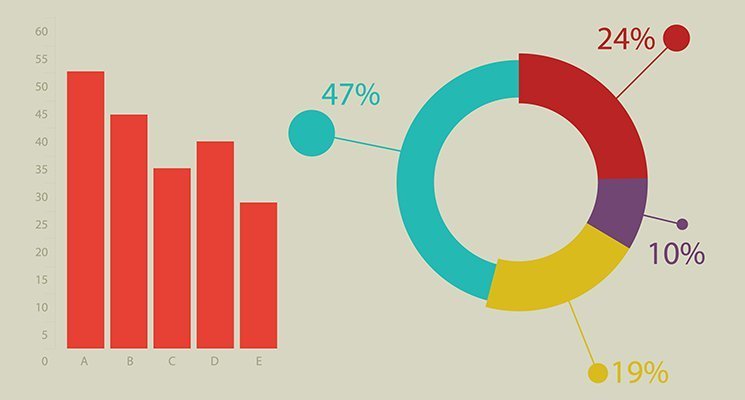
 This season, to startlingly effective results, the San Francisco 49ers have been flooding fans with infographics. The great thing about infographics, visual representations of data or knowledge, is their quick, clear presentation of complex information. And the great thing about infographics designed by someone who knows what they’re doing is their quick, clear, and beautiful presentation.
 This season, to startlingly effective results, the San Francisco 49ers have been flooding fans with infographics. The great thing about infographics, visual representations of data or knowledge, is their quick, clear presentation of complex information. And the great thing about infographics designed by someone who knows what they’re doing is their quick, clear, and beautiful presentation.
Take, for example, the one the 49ers posted a couple weeks ago, just before their last game at Candlestick Park, where they played for 42 years (which I know from glancing at the infographic). It’s truly a work of art, and in addition to its stellar design, it gives fans all the detailed information they need to feed their nostalgia till long after the team moves to their new stadium later this year. But what I really like about this is that it’s a great model for any sports or fitness facility, whether you’re a stadium, an ice rink, a health club, a baseball center, or any other venue in the industry.
Any facility could design and distribute something similar to bolster support from clients, members, fans, or just the surrounding community. Make a timeline of your history, starting with when you first opened or when plans for your facility first began. Pick out the moments you want to highlight, and then make a list of interesting facts. You can mix up both number facts and fun-to-know facts: for example, the number of trainers you have, the number of young athletes you serve who have gone into professional sports, the number of Olympic medalists who have visited your facility, or: tidbits about celebrities who have visited, a description of the most outrageous kind of class you ever offered, and anecdote about a funny or moving incident that occurred. You can also include, as the 49ers did, interesting quotes about your facility from the people who work there. You can add a thank-you message, if your goal is to show appreciation for your members. What you choose to include is limited only by your imagination and your designer’s talents.
After you’ve got an infographic you’re happy with, send it out into social media-land. This is a place where infographics thrive, because they attract attention, so people like to share them; they provide a whole load of information at a glance, so there’s a quick payoff to looking at them; and they efficiently demonstrate to others the loyalties and interests of the individual posting them. Depending on the occasion — if it’s an important anniversary, for example, or if you’re sponsoring a big fundraiser — you can even turn them into posters to hand out. (Sometimes, they really do look good enough to hang on the wall.)
If you get positive feedback, consider creating infographics regularly. The 49ers did one every few days this season and got tons of comments and shares in response. Even if you do it only once a month, you’ll have found a great way to spread information about your facility, hold people’s attention, and dole out some eye candy.

Creating Infographics
« Blog | | | (0) Comments |